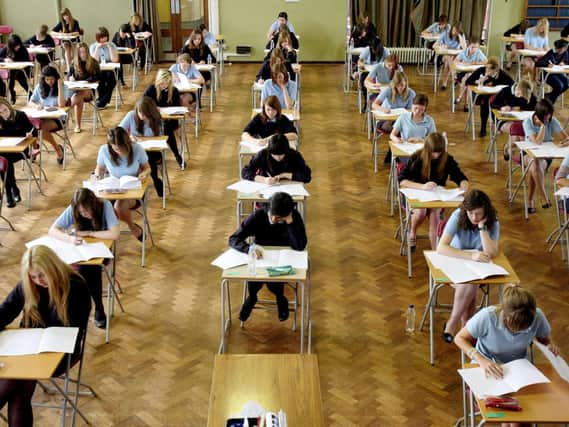
Here are the best and worst-performing secondary schools in the Portsmouth area


The results, released by the Department for Education, indicate that students attending Portsmouth state schools have on average attained lower Progress 8 scores than last year.
Progress 8 was brought in to judge schools on student progress rather than outcome.
Advertisement
Hide AdAdvertisement
Hide AdA Progress 8 score is calculated by each subject being given a numerical value for the eight subjects being taken.


Student performance is then calculated by comparing national outcomes of students of the same pre-assessed academic ability.
Students in Portsmouth scored an average Progress 8 score of -0.33 compared to -0.14 in the previous year.
The score indicates that on average Portsmouth pupils attained roughly a third of a grade lower than comparable students nationally.
Advertisement
Hide AdAdvertisement
Hide AdThe city's Progress 8 scores in mathematics and English have fallen by more than double that of 2017 with English scores decreasing from -0.05 to -0.22 and from -0.05 to -0.17 in mathematics.
Hampshire Local Authority has seen their average Progress 8 score rise from -0.14 to -0.09.Â
Understanding how your child's school performed
In addition to changing the parameters by which schools assess students the new system has also brought in a whole new format for parents to understand the performance of their children and their schools.
Ultimately a Progress 8 score of 0 indicates a student has made the same amount of progress, on average, as students with the same Year 7 starting point nationally.
Advertisement
Hide AdAdvertisement
Hide AdA positive reading would reflect better than average progress and a negative reading would indicate below average progress. Up to -0.25 students are still categorised as having made expected progress. Schools with a progress score of between -0.25 and -0.5 would be classed as '˜coasting' therefore be a potential concern.
The government's minimum required '˜floor target' is -0.5 which would indicate that on average children were attaining roughly half a grade lower than comparable students nationally.
When calculating a student's Progress 8 score their performance in maths and English are given double weighting to represent the importance of these two key subjects.Â
The percentage of students attaining a grade 5 and above in maths and English is still present as a separate indicator of performance.
Advertisement
Hide AdAdvertisement
Hide AdUnder the old system a level 5 would be the equivalent of a high grade C.
How did your child's school perform?
The schools for each area are ranked by their Progress 8 score. Their 2018 score is on the left, and the 2017 score is in the centre.Â
The figure on the right is the percentage of pupils who reached at least grade 5 and above in English and Maths.
Portsmouth
St Edmunds  0.56  '“  0.83  '“  58%
Portsmouth Academy  0.15  '“  0.47  '“  47%
Ark Charter Academy  -0.06  '“  -0.1  '“  47%
Advertisement
Hide AdAdvertisement
Hide AdAdmiral Lord Nelson  -0.11  '“  -0.08  '“  46%
Springfield School  -0.12  '“  n/a  '“  50%
Priory School  -0.42  '“  -0.44  '“  40%
Mayfield School  -0.46  '“  -0.16  '“  23%
Miltoncross Academy  -0.68  '“  -0.25  '“  29%
Trafalgar School  -0.74  '“  -0.4  '“  22%
Â
Havant and Waterlooville
Oaklands Catholic School  0.09  '“  -0.05  '“  48%
The Cowplain School  0.02  '“  -0.04  '“  31%
Advertisement
Hide AdAdvertisement
Hide AdHorndean Technology College  -0.07  '“  -0.03  '“  40%
Hayling Academy  -0.18  '“  -0.2  '“  42%
Purbrook Park School  -0.27  '“  -0.09  '“  28%
Warblington School  -0.47  '“  -0.45  '“  38%
Crookhorn College  -0.48  '“  -0.3  '“  38%
Park Community School  -0.8  '“  -0.42  '“  14%
Havant Academy  -0.82  '“  -0.05  '“  19%
Â
Gosport and Fareham
Cams Hill School  -0.12  '“  -0.36  '“  56%
Crofton School  -0.11  '“  0.02  '“  49%
Advertisement
Hide AdAdvertisement
Hide AdHenry Cort Community College  -0.08  '“  -0.09  '“  45%
Bay House School  -0.17  '“  0.21  '“  39%
Bridgemary School  -0.48  '“  -0.65  '“  12%
Brune Park Community School  -0.44  '“  N/A  '“  21%
Fareham Academy  -0.49  '“  -0.33  '“  31%
Portchester Community School  -0.59  '“  -0.44  '“  32%
Swanmore College  0.04  '“  -0.05  '“  56%
Brookfield Community School  0.28  '“  0.09  '“  54%    Â