
Some parts of England have seen house prices rocket by as much as 50 per cent or more in just a year, analysis of official figures shows.
The Office for National Statistics publishes localised house price figures, based on the UK House Price Index, breaking England into 6,809 neighbourhoods known as middle-layer super output areas.
As the figures cover small areas, average house prices can fluctuate due to low sales numbers and can be heavily influenced by factors such as a new development in the area.
Here we reveal which neighbourhoods in Portsmouth have seen the greatest decrease in property prices in the last year, as well as neighbourhoods where prices have either stagnated, or not kept pace with the rest of the market.
Images are for illustrative purposes only.
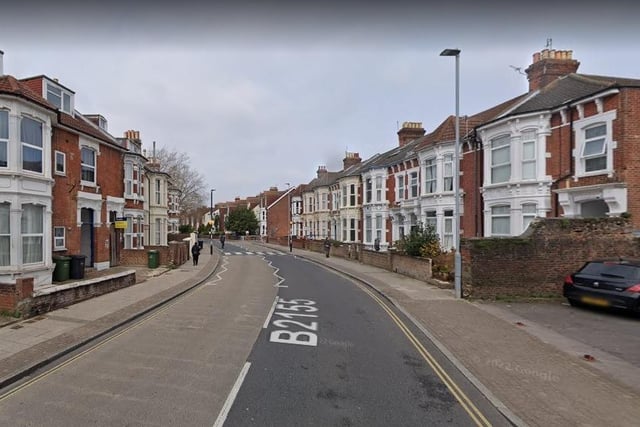
1. Waverley Road, Southsea
In Southsea Waverley Road, the average house price decreased from £268,250 in September 2021 to £228,750 in September 2022, marking a decrease of £39,500 or -14.7%. Photo: Google Street View
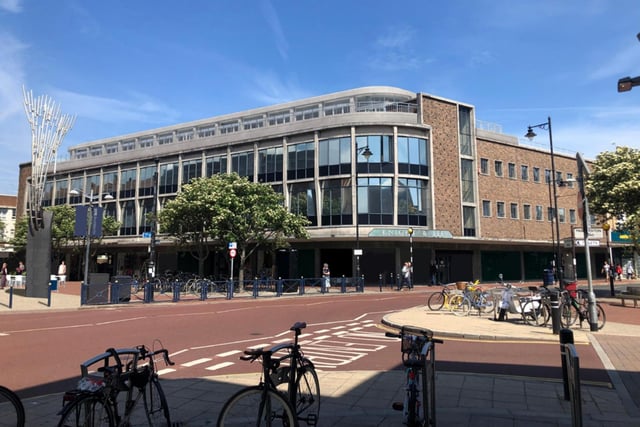
2. Southsea West
In Southsea West, the average house price decreased from £226,000 in September 2021 to £194,500 in September 2022, resulting in a decrease of £31,500 or -13.9%. Photo: That Group
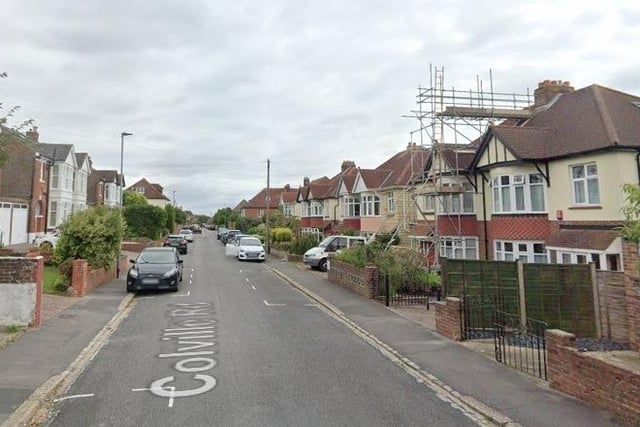
3. Cosham North
House prices in the north of Cosham are the highest anywhere in the city, with an average cost of £355,000. Photo: -
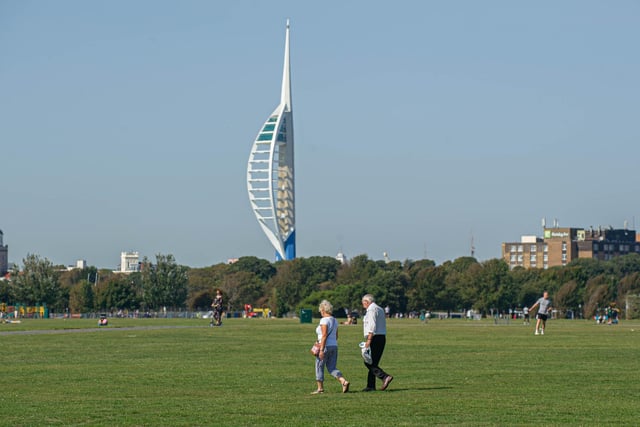
4. Old Portsmouth & Southsea Common
In Old Portsmouth & Southsea Common, the average house price decreased from £310,000 in September 2021 to £290,000 in September 2022, resulting in a decrease of £20,000 or -6.5%. Photo: Habibur Rahman