

Figures from the Office of National Statistics (ONS) show the changes between 2014 and 2019 in council wards across Portsmouth.
The data showed that nine of the city’s 14 wards had an increase in population during the time frame.
MORE: Full list of shops remaining open in Cascades Shopping Centre during lockdown | Can you spot yourself in our gallery of Southsea clubbers in the 00s?
We have listed the wards from lowest increase to largest percentage increase.
Click through the gallery below to see if the population has grown.
A message from the Editor, Mark Waldron
The News is more reliant than ever on you taking out a digital subscription to support our journalism.
You can subscribe here for unlimited access to Portsmouth news online - as well as our new Puzzles section.
MORE: Full list of shops remaining open in Cascades Shopping Centre during lockdown | Can you spot yourself in our gallery of Southsea clubbers in the 00s?
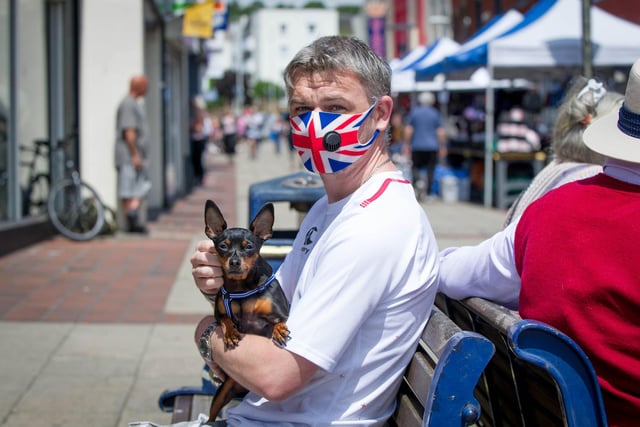
5. Cosham
In the five years between 2014 and 2019, the population in Cosham increased by 2.5 per cent - rising from 14,452 to 14,813. Photo: Habibur Rahman
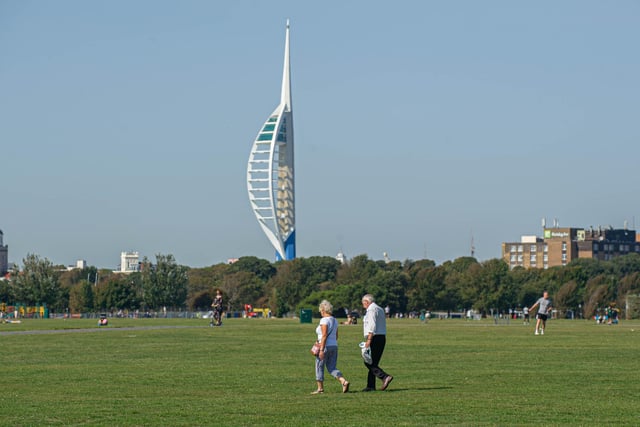
6. St Jude
In the five years between 2014 and 2019, the population in St Jude increased by 4.6 per cent - rising from 12,413 to 12,986. Photo: Habibur Rahman
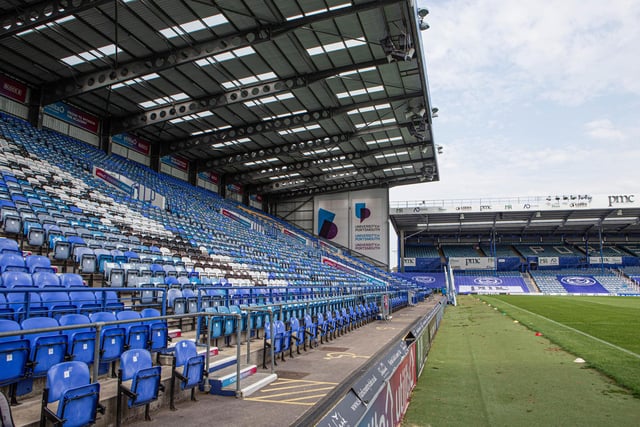
7. Milton
In the five years between 2014 and 2019, the population in Milton increased by 5.5 per cent - rising from 13,897 to 14,667. Photo: Habibur Rahman
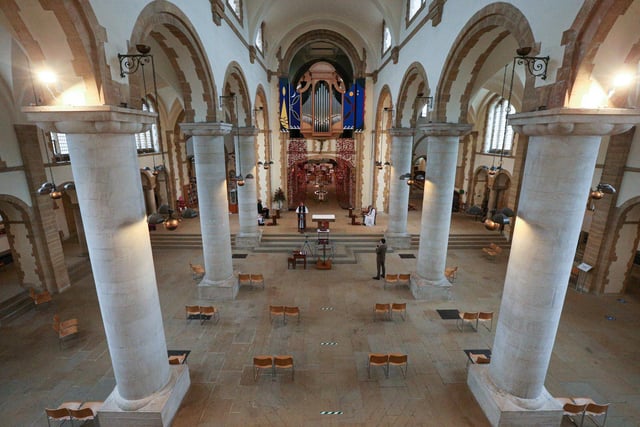
8. St Thomas
In the five years between 2014 and 2019, the population in St Thomas increased by 6.4 per cent - rising from 16,503 to 17,558. Photo: Chris Moorhouse