

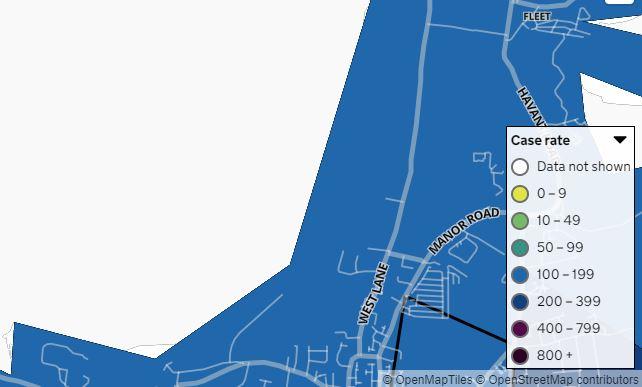
In the figures, it is broken down into different districts such Waterlooville East.
It shows the number of cases recorded in the seven days to August 8 and the rate of infection at the time.
We have collected the data into an easy to view gallery which you can see below – make sure to click through all the pages.
MORE COVID NEWS: Biggest Covid hotspots in Hampshire | Latest number of Covid cases where you live
The gallery includes areas where the infection rate was lower than 200.
The list is in descending order finishing with the area with the lowest infection rate.
You can subscribe here for unlimited access to Portsmouth news online - as well as less adverts, access to our digital edition and mobile app.
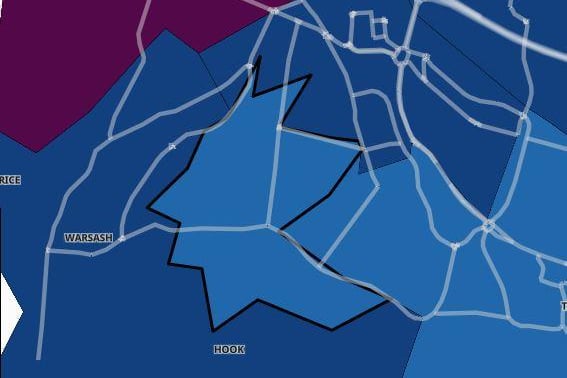
2. Locks Heath
The Covid infection rate in Locks Heath was 199.8 cases per 100,000 in the seven days to August 8. However Cases increased by 6.7 per cent in that period. Photo: -
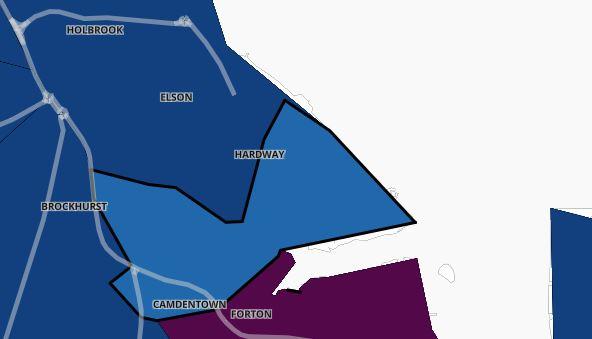
3. Priddy's Hard and Brockhurst East
The Covid infection rate in Priddy's Hard and Brockhurst East was 199 cases per 100,000 in the seven days to August 8. Cases fell by 18.2 per cent in that period. Photo: -
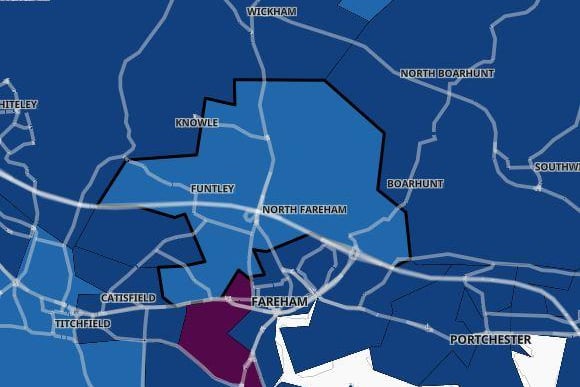
4. Fareham Common
The Covid infection rate in Fareham Common was 179.2 cases per 100,000 in the seven days to August 8. Cases fell by 20 per cent in that period. Photo: -