

In the figures, the county is broken down into different neighbourhoods such as Cosham South.
It shows the number of cases recorded in the seven days to January 6.
COVID LATEST: Latest coronavirus case numbers for Hampshire | These are the 7 areas with the fewest double-jabbed people in Portsmouth | Exact location of all the Omicron cases in the UK so far
We have pulled together the X areas where coronavirus cases fell across the Portsmouth area.
Areas are listed from lowest to highest rates.
You can now subscribe here for unlimited access to our online coverage, including Pompey, for less than 13p a day.
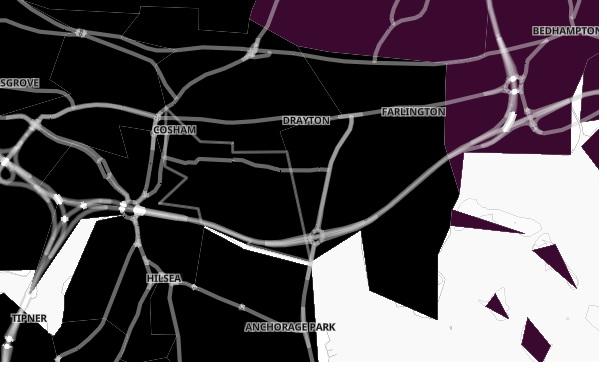
5. Cosham South
Cases fell by 5.4 per cent in Cosham South in the seven days to January 6. However the case rate was still 1,699.1 per 100,000. Photo: -
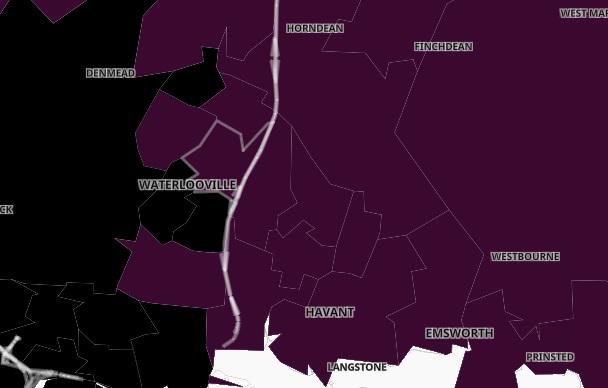
6. Waterlooville North East
Cases fell by 5.9 per cent in Waterlooville North East in the seven days to January 6. However the case rate was still 1,699.1 per 100,000. Photo: -
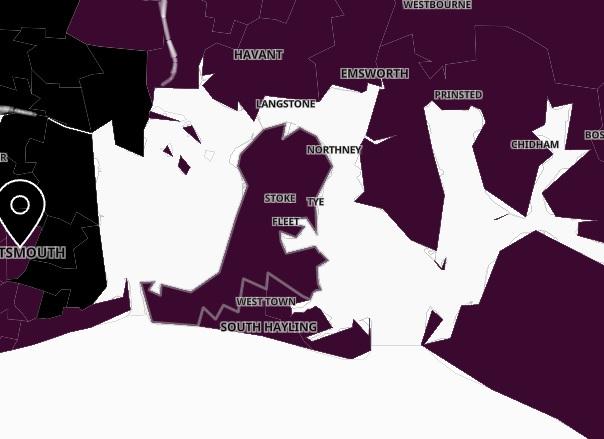
7. Hayling North and West
Cases fell by 7.5 per cent in Hayling North and West in the seven days to January 6. However the case rate was still 1,020.9 per 100,000. Photo: -
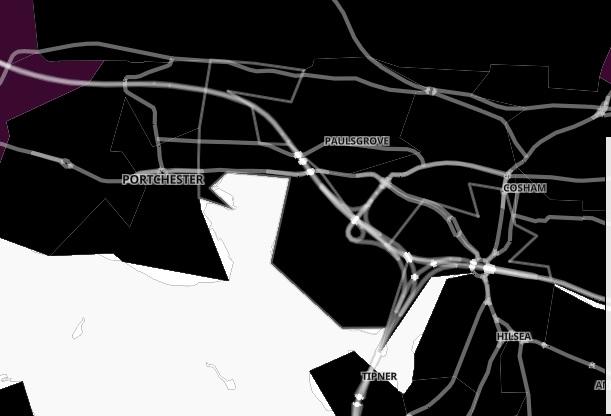
8. Paulsgrove West and Port Solent
Cases fell by 7.8 per cent in Paulsgrove West and Port Solent in the seven days to January 6. However the case rate was still 1,679.6 per 100,000. Photo: -